FYI from BSF, 3.8.24
Enrollment and enrollment patterns are notoriously complex, with factors ranging from birth rates to geopolitical displacements.
But, over time, there are some patterns that are enduring. Recently released state data show something very consistent in Boston and across the Commonwealth: when kids leave a school (“attrition”).
With the exception of pandemic increases, attrition rates are remarkably consistent.

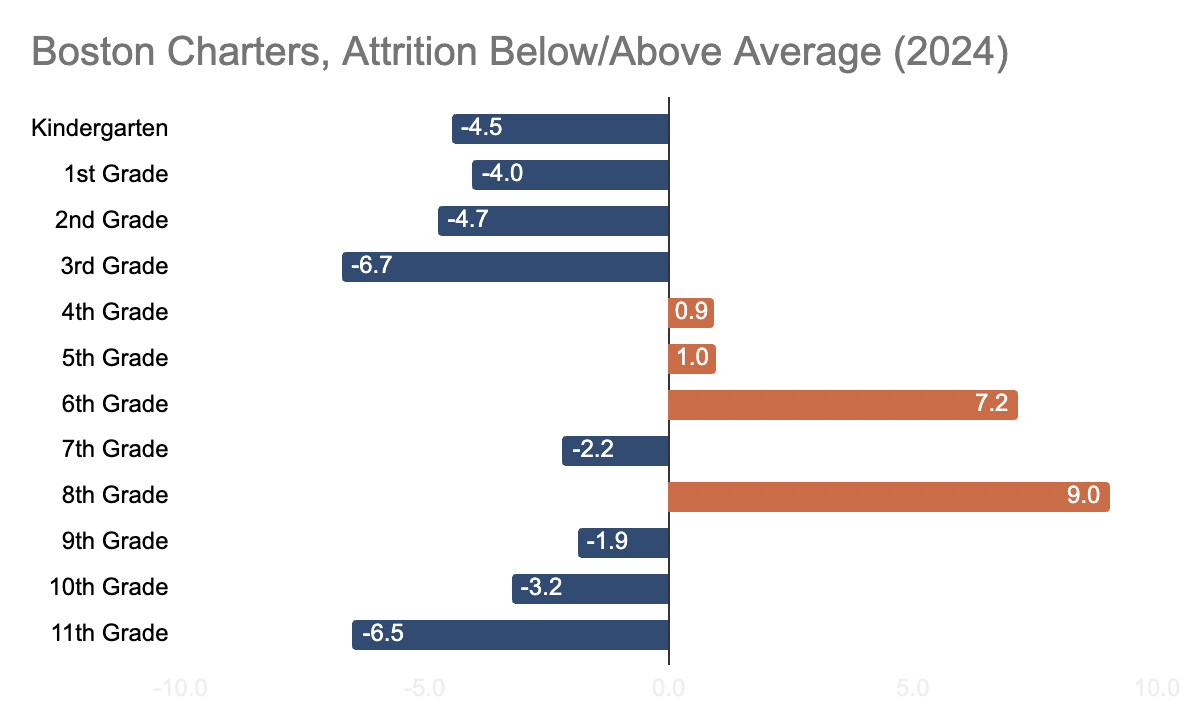
Despite this consistency, Boston's attrition rates vary by grades. The majority of grades post rates below the district average; attrition disproportionately happens at the end of 4th grade, 5th grade, and 8th grade.

8th grade attrition appears to be a statewide trend; every year it is ~2x any other grade or the state total average.
During the past decade, Boston charter enrollment has essentially doubled, with all but one charter school in the city offering a 5th or 6th grade seat. This likely contributed to Boston Public School attrition in those middle grades.
Boston’s charters post a higher overall attrition rate (13.4) with a similar distribution to the district with the exception of 6th grade, which may be due to exam schools or other BPS or independent school 7-12 options.
There are a lot of kids changing schools in Boston between the age of 10 and 14. These transitions create real operational costs and hidden taxes on children’s academic and socioemotional development.
The smooth lines are much messier up close.
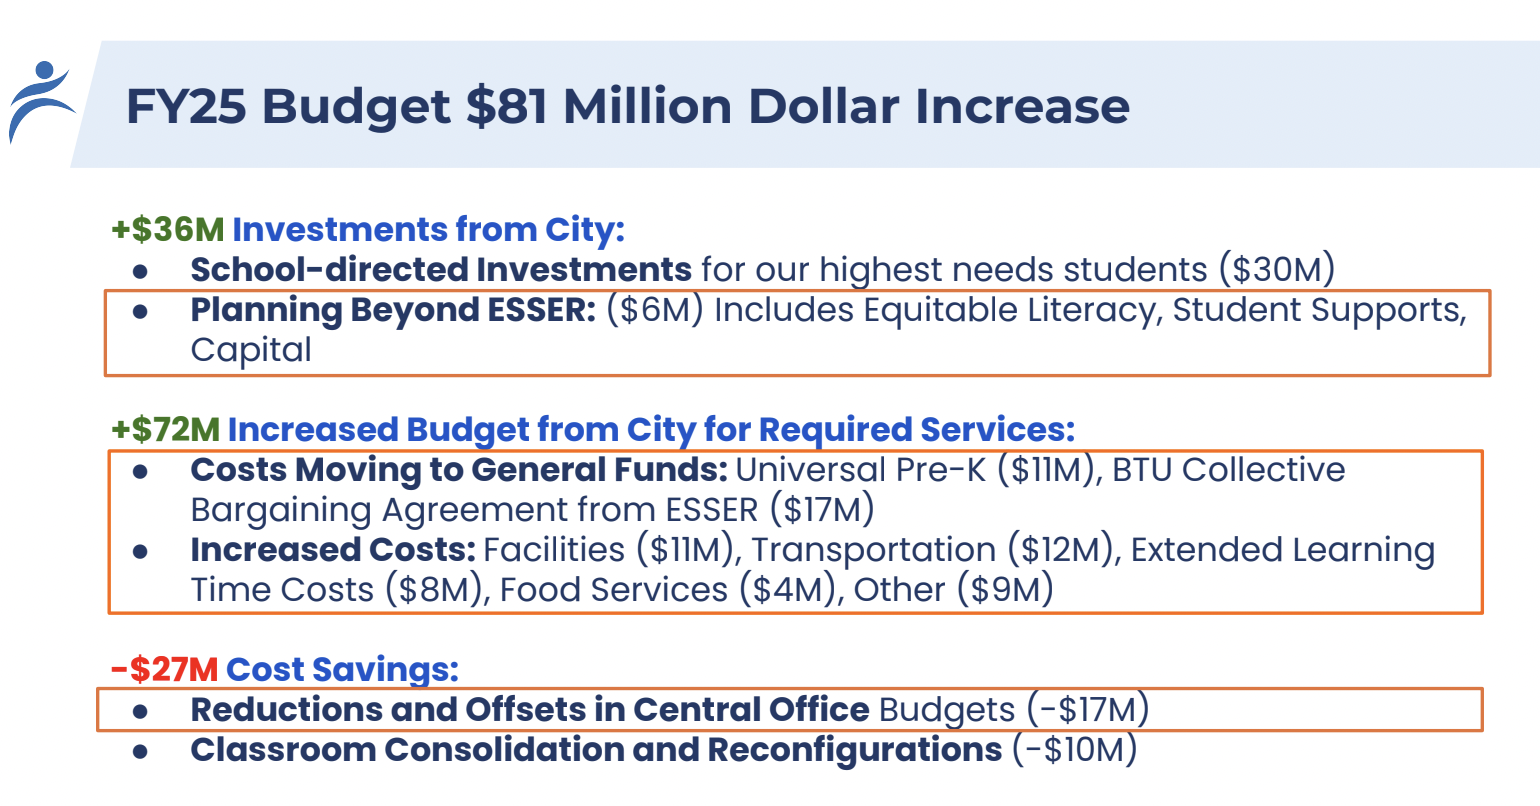
Does Boston spend too much on its schools? This analysis asks that question and lays out the data and the argument that - relative to state standards and neighboring communities - that Boston spends less.
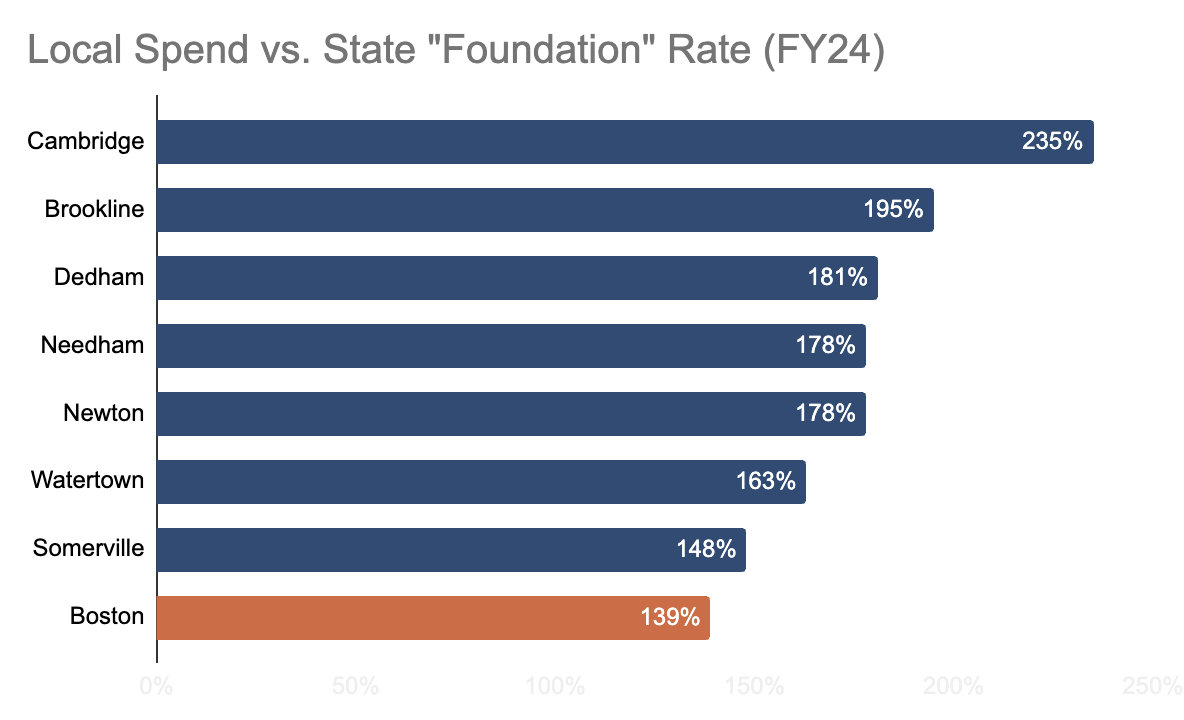
But, of course, cities and towns have to spend money on other things besides schools. The graph looks very different when you account for the total local budget, the reality of a relatively fixed pie and multiple priorities. From this perspective, Boston spends more.

Affording this hasn’t really been in question for a generation. But a City Council hearing is raising questions about the city’s commercial tax base and what a potential decline could mean for schools and other city services.
The beginning of the School Committee meeting addressed the allegations that a 3 year-old child with special needs was bound to a chair by teachers at the Condon School at South Boston. Extensive media scrutiny has addressed the actual incident (Superintendent Skipper: “totally unacceptable;” Mayor Wu: “may have been a breach of policy;” Boston Teachers Union: “referred questions to Boston Public Schools”), as well as the delayed notice to the child’s mother.
Just this week, an extensive examination of applied behavior analysis (“ABA”), an approach utilized widely in Boston, Massachusetts, and across the country, questions its effectiveness for students with autism.
The Carter School, a BPS school for students with significant cognitive and physical impairments, is one big step closer to a new building.

Some big education news at the State House. The potential ballot question to repeal the MCAS graduation requirement had its first public hearing. Just yesterday the Senate announced a bill to expand early child care subsidies for both centers and families.
Thought the “math wars” were pitched in greater Boston? In San Francisco, they actually voted on it. It may be the first popularity contest algebra ever won: ~5 out of 6 voters approved a non-binding referendum to offer the class in 8th grade.